The plate reader has finished. You have a workbook, a plate map, and a few notes about the wells that looked wrong. The analysis starts when someone brings those records together.
An AI assistant can help with that work: inspect sheets, organize measurements, run calculations, and produce a first figure. Its choices depend on what it knows about the experiment. A column of numbers does not tell it whether three rows came from three donors or three wells from the same donor.
That distinction is a good place to start when introducing AI into wet-lab data analysis. Give it a small, well-described task whose output you can inspect. Expand the task after the first result survives that inspection.
The spreadsheet is only part of the record
Keep the original instrument export. Add the plate map and the information needed to interpret it: sample identifiers, concentration units, controls, dilution factors, and the relationship between repeated measurements. A separate metadata table is fine if its identifiers match the measurements.
Use names that preserve those relationships. A table with donor_id, condition, technical_well, and signal_au is easier to interpret than a block of unlabeled columns headed “A,” “B,” and “C.” If condition names live in a second sheet, say which sheet contains them. Color alone is a fragile way to encode the experiment.
Be equally specific about what has already happened to the numbers. Raw fluorescence, background-subtracted fluorescence, and percentage of control may describe the same wells at different processing stages. An instruction to normalize data that are already normalized can quietly change the result.
Thirty-six wells, six donors
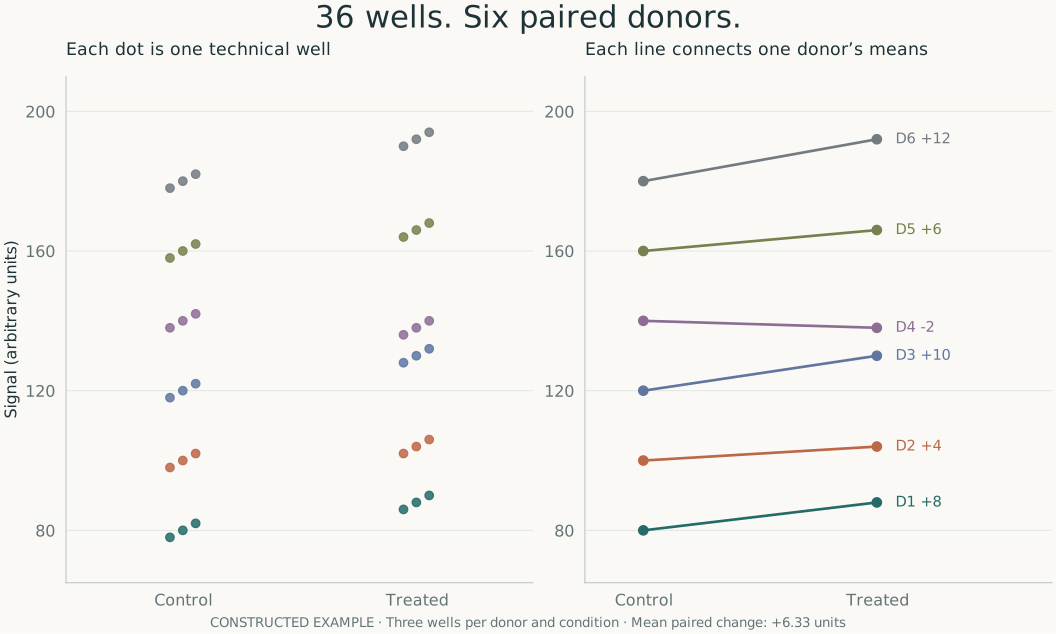
Consider a constructed example: six donors, two conditions per donor, and three technical wells per condition. There are 36 measurements. The biological comparison is paired within six donors.
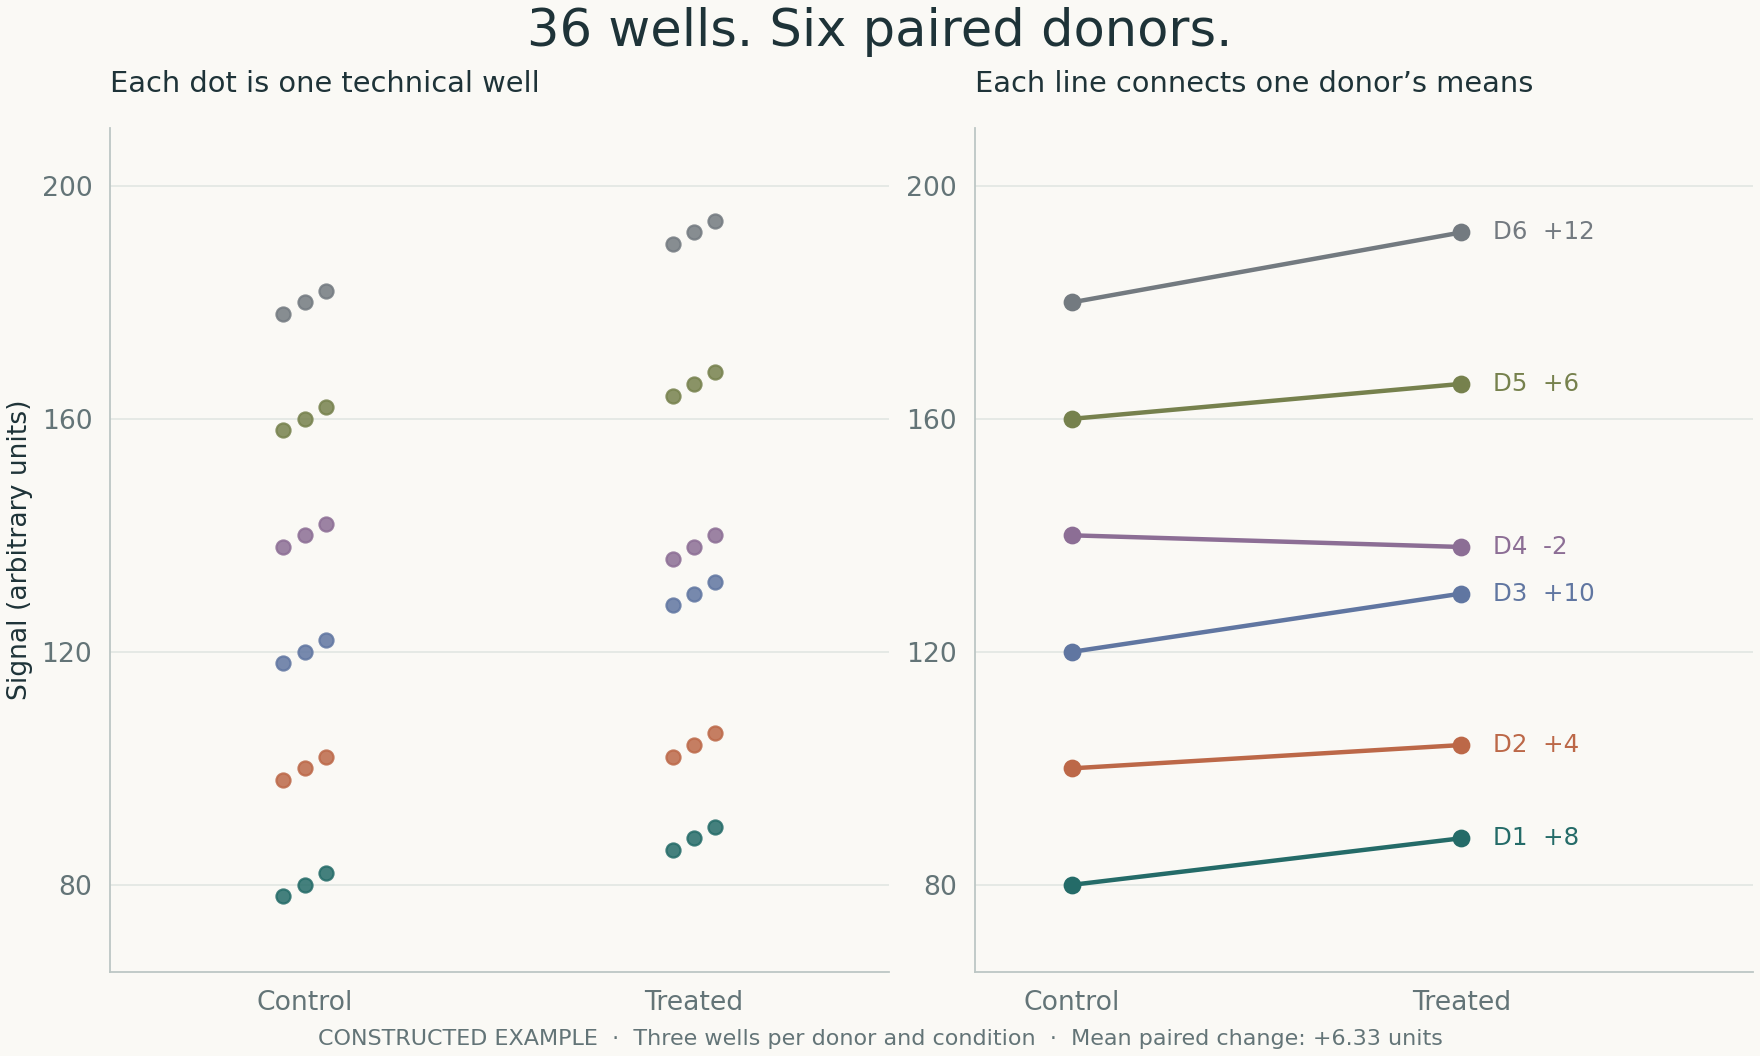
The donor-level changes are +8, +4, +10, −2, +6, and +12 signal units. Their mean is +6.33 units. Five donors increase; one decreases. That is a more informative description than a pair of bars that hides the matched samples.
In this balanced example, subtracting the two grand means also gives +6.33. Getting that number right would not establish that the assistant understood the design. Treating the wells as independent biological replicates would still give it the wrong basis for estimating uncertainty. If well counts were unequal, simple pooling could also give some donors more weight.
Replicate structure matters in other assays too. Zimmerman and colleagues examined pseudoreplication in single-cell studies, where many cells are nested within a smaller number of individuals. Their study illustrates why the number of observations and the number of independent experimental units need to be distinguished. [1] The figure here makes the same design issue visible using a small, deliberately constructed plate example; it contains no experimental findings or significance test.
A short brief that changes the analysis
A useful request gives the assistant the experiment, the question, and the first output you need. For the example above, that could be:
Each donor has control and treated samples. The three wells within each donor and condition are technical replicates. Signal is in arbitrary units and has not been normalized.
Show the individual wells, calculate each donor’s condition means, and plot the paired change. Report the mean paired change across donors. This first pass is descriptive; keep the donor identifiers in the output.
That request gives you several easy checks. There should be six paired changes. Each condition mean should use three wells. The plotted donor labels should match the input. You can verify one donor by hand before looking at the overall summary.
For a concentration-response assay, the brief would need different facts: which column holds concentration, whether it is already logarithmic, what the controls represent, and whether you want a relative midpoint or a 50%-of-control endpoint. Our IC50 troubleshooting guide shows how those last two definitions can produce different answers from the same fitted curve.
Keep the first task small enough to inspect
Start with one plate, one comparison, or one fitting problem. Ask for a plot of the source measurements before a long interpretation. Inspect the file and sheet selection, sample counts, axes, and controls. Those checks often tell you more about the analysis than the fluency of the written summary.
Some steps fit naturally into a repeatable procedure: reading a documented layout, applying a specified dilution factor, fitting an agreed equation, or redrawing a checked result. Other steps involve choices the assistant cannot recover from the readings. It cannot establish that a sample label is wrong because a point looks unusual, or recover a dilution factor from a smooth standard curve.
Give those unresolved questions a place in the workflow. “Report the measured-well concentration while we confirm the dilution” can be a useful partial result. Reporting an original-sample concentration with an assumed dilution loses that distinction.
Judge the handover by what you can use
A good first pass should leave you with a plot you can explain, a table whose rows you recognize, and a short account of the choices that changed the result. If observations were excluded, you should be able to identify them and the reason. If the analysis used an assumption, it should be visible at the point where it matters.
When testing a tool for your lab, use a completed analysis with a known reference result. Record the work needed to prepare the input, correct the output, and check it. Any time comparison should include that review. We have not measured a time saving in this example.
For Gradiance, the uploading guide covers input preparation, and the group-comparison guide covers the analysis context. The companion article on how an analysis agent works follows what happens after a request is submitted.
Data and reference
Download the 36-row example CSV, calculated summaries, and figure script. The values are specified teaching data, not measurements from donors. The reproduction notes explain how to regenerate all figures in this article series.
[1] Zimmerman KD, Espeland MA, Langefeld CD. A practical solution to pseudoreplication bias in single-cell studies. Nature Communications. 2021;12:738. DOI: 10.1038/s41467-021-21038-1.