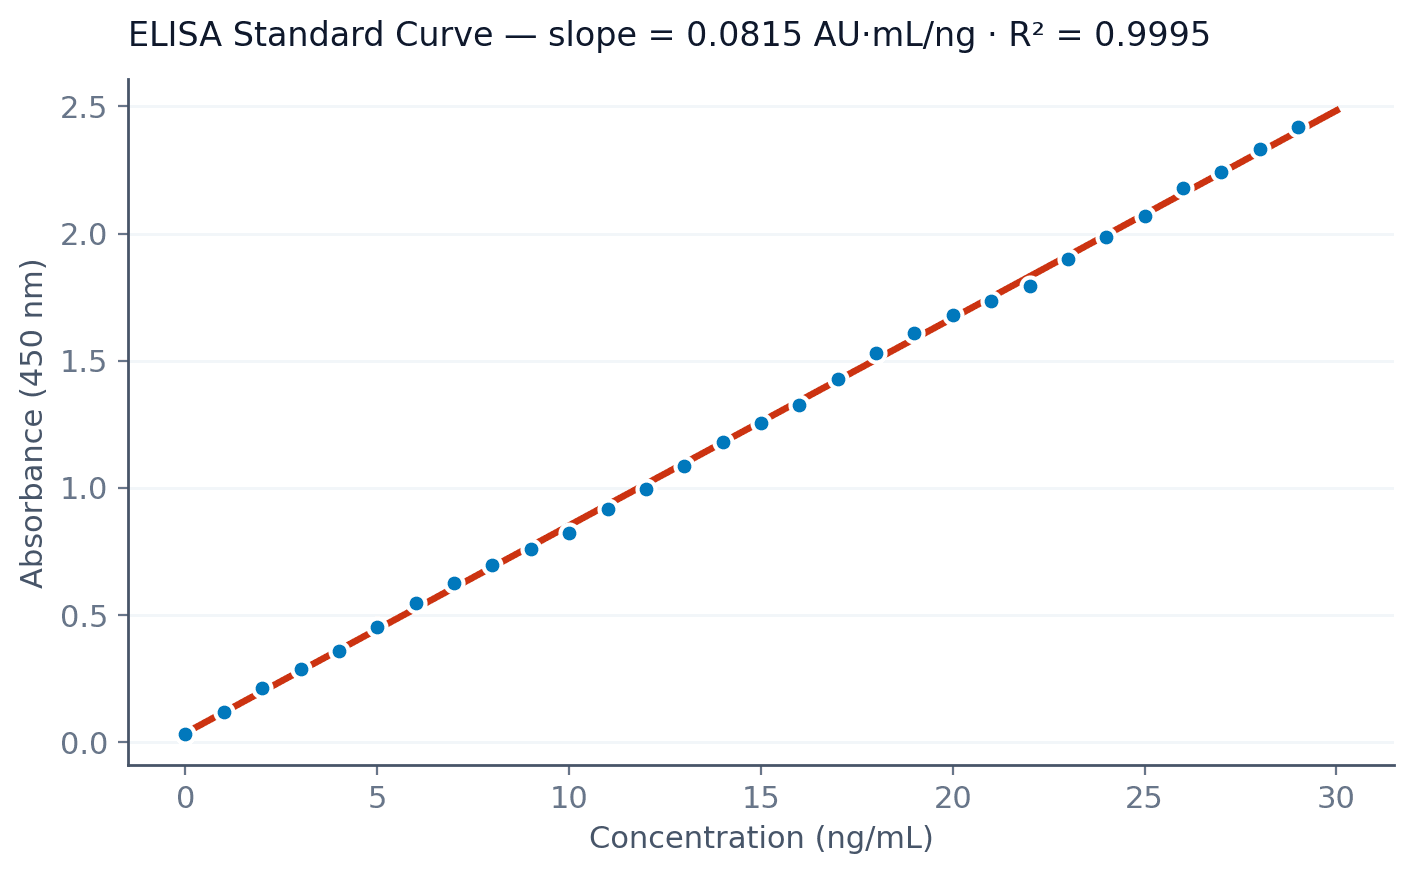
Slope 0.0815 AU·mL/ng, intercept 0.0370 AU, R² = 0.9995 across thirty calibration points spanning 0 to 29 ng/mL. The fit is plain linear — not log-log — because the data are linear-in-concentration over this range and a log-log model would mis-shape the residuals near zero.
§ 01The plate
The CSV in the database has one row per concentration, 30 points from 0 to 29 ng/mL in 1 ng/mL steps, OD reported directly. No duplicates structure in this version of the file; that's a thing to flag if you're running a real plate and want CV-based QC.
Gradiance picked the standards by column naming, fit a linear model on the untransformed (concentration, OD) axes, and tagged the fit "excellent" under its R² ≥ 0.99 quality tier.

§ 02The fit
A reagent insert calls for R² ≥ 0.99. This run came in at 0.9995, comfortably above. The slope (0.082 AU per ng·mL⁻¹) and intercept (0.037 AU) are the two parameters you carry forward to back-calculate every sample on the plate.
§ 03Back-calculation
Every sample well runs through the inverse fit and gets a concentration in ng/mL. Samples above the highest standard (29 ng/mL) are flagged as extrapolations and need a re-dilution before they go into a supplementary table; samples below the lowest standard get a different flag — those are near the lower limit of detection.
import pandas as pd
# Fit parameters from the standard curve (linear, untransformed axes)
slope = 0.0815 # AU per (ng / mL)
intercept = 0.0370 # AU
samples = pd.read_csv("plate_samples.csv")
samples["conc_ng_per_ml"] = (samples["od_corrected"] - intercept) / slope
# Flag out-of-range values
samples["flag"] = "OK"
samples.loc[samples["conc_ng_per_ml"] > 29, "flag"] = "EXTRAP_HIGH"
samples.loc[samples["conc_ng_per_ml"] < 0, "flag"] = "EXTRAP_LOW"
samples.to_csv("samples_back_calculated.csv", index=False)§ 04QC
The standard-curve QC gate is short: R² above the kit threshold, every back-calculated standard within 20 % of its nominal, and any spike controls inside 80–120 % recovery. Gradiance computes all three and tags pass or flag. When a duplicate-well structure is in the file, it also computes per-pair CV and flags anything above the 10 % limit most inserts call for.
§ 05When linear stops working
Many ELISAs are linear over their working range; some aren't. Sandwich kits with very high top standards often need a 4PL to capture the upper plateau without bias. Gradiance flags this: if the residuals from the linear fit show the C-shape that gives away an unmodelled plateau, the agent suggests a 4PL re-fit and shows both side-by-side.
Drop your CSV. Get the figure.
Free for three runs a month. No card. No template. The audit trail is on by default.