
We uploaded the open Puromycin dataset to the production Gradiance web app and checked the resulting Michaelis–Menten parameters against a separate SciPy calculation. Both conditions agreed to within 0.001% for Vmax and Km. This is a numerical check on one dataset, not a general validation of the product.
Data and analysis
The R dataset documentation describes 23 reaction-rate observations: 12 treated and 11 untreated. Concentration is in ppm; reaction rate is in counts/min/min. The experiment was conducted once per condition, so the observation counts must not be interpreted as independent biological sample sizes.
We fitted each condition separately to v = Vmax × S / (Km + S), using every observation without averaging or exclusions. The independent reference uses unweighted nonlinear least squares with nonnegative bounds and initial values Vmax = 200 and Km = 0.05. It imports no Gradiance analysis code.
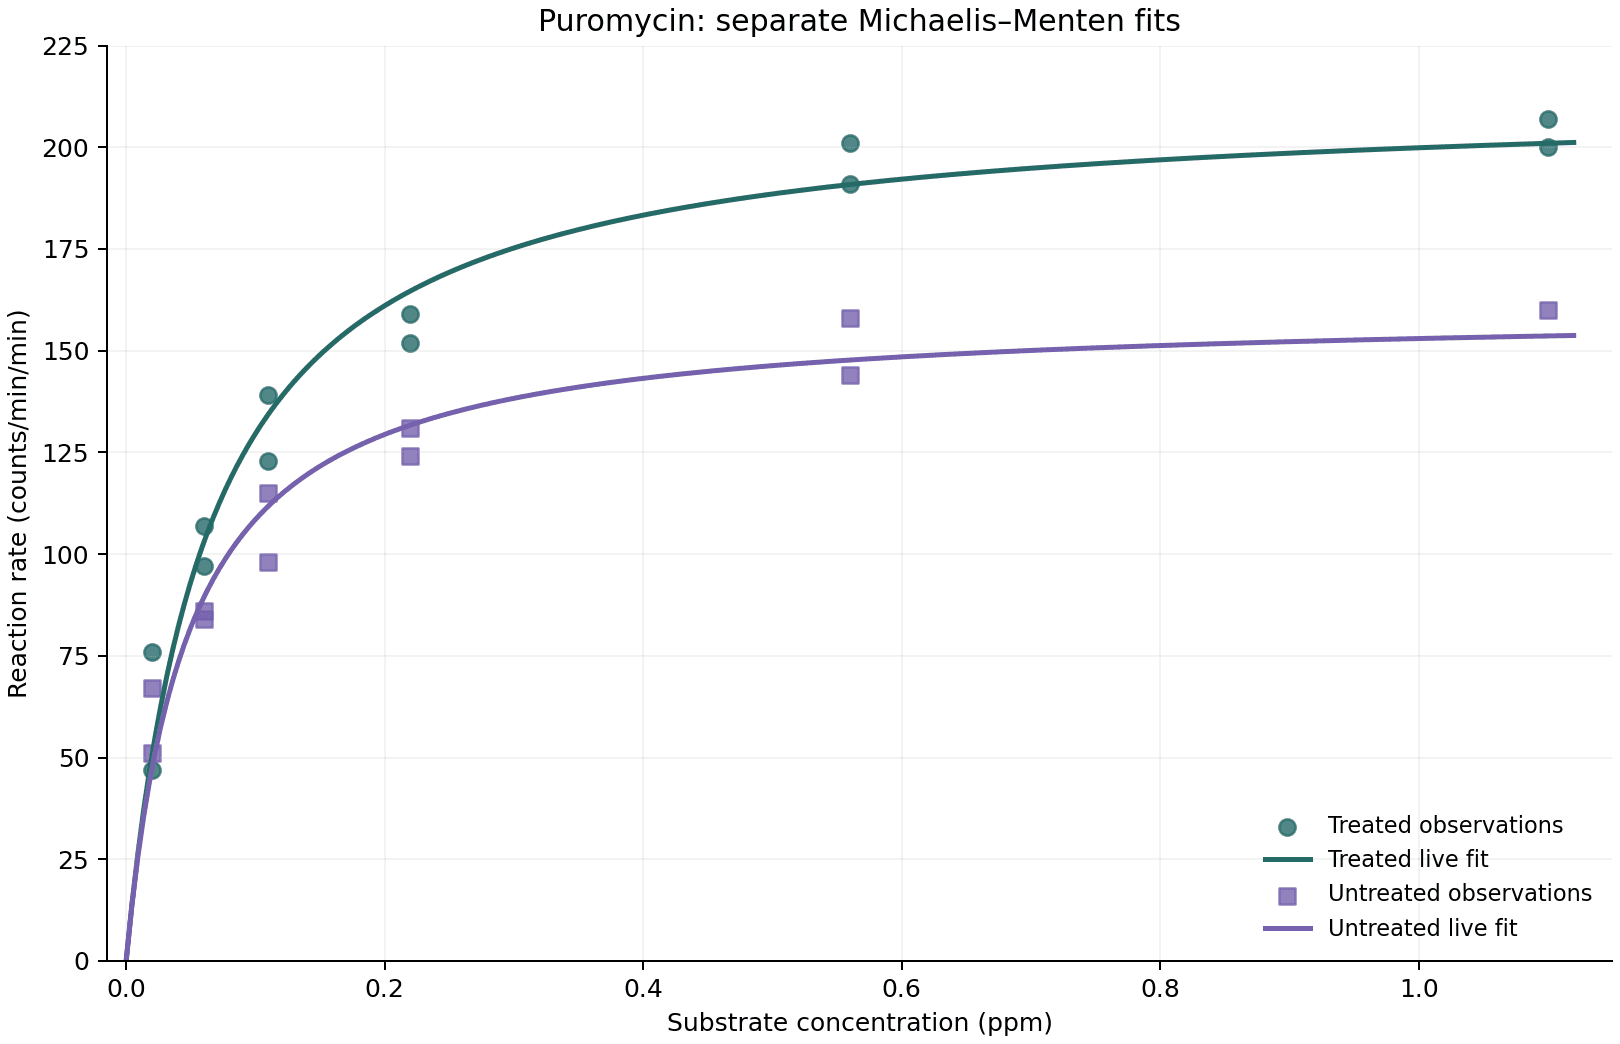
Live result and independent calculation
| Condition | Parameter | Live app | Independent |
|---|---|---|---|
| Treated | Vmax (counts/min/min) | 212.683859 | 212.683579 |
| Treated | Km (ppm) | 0.06412146 | 0.06412103 |
| Untreated | Vmax (counts/min/min) | 160.280124 | 160.280153 |
| Untreated | Km (ppm) | 0.04770830 | 0.04770835 |
Live R² was 0.9613 for treated and 0.9356 for untreated. The reported 95% parameter intervals were Vmax 197.2–228.2 and Km 0.04567–0.08257 for treated; Vmax 145.6–174.9 and Km 0.03010–0.06531 for untreated. These intervals describe fit uncertainty under model assumptions. We checked parameter agreement independently; we have not independently validated the interval coverage.
What the workflow revealed
The first attempt failed before reaching the model because token estimation did not handle a structured chat-message type. We fixed that defect and retried the same run. The retry completed, but progress updates required a page reload. The original instructions did not survive the failed-run restore path, and the result described the units as unlabeled. It also included four linearized diagnostic panels alongside the two requested nonlinear fits.
Those issues matter even when the fitted numbers agree. The saved output below preserves them. Subsequent corrections to instruction persistence and the selected-fit parameter sidebar have been deployed; the historical run still lacks its original request. This report does not claim that every recovery path or the full product has passed end-to-end validation.
We also downloaded and executed this run’s Python export: it preserved all six saved fits and rendered three compatible coordinate groups. That export replays saved values; it does not refit the source data or rerun the assistant. The downloaded audit bundle’s result and script hashes matched the checked content, but its original request was missing, its code trace was empty, and its temporary input fingerprint was unavailable. The separately recorded source checksum below does not fill those gaps in the run’s own provenance.
These data do not establish a treatment mechanism, inhibition constant, or statistically significant biological difference. Comparing the two fitted curves does not replace an experimental design with independent replicates.
Reproduce the check
- Source CSV from Rdatasets
- Saved live result fields — parameters, diagnostics, and all six reported panels; run identifiers and UI text omitted.
- Figure rendering script — uses the source CSV and saved live parameters without refitting.
- Independent reference script and reference output with package versions.
Download the CSV and script, then run python reproduce.py Puromycin.csv with NumPy, pandas, and SciPy installed. Our reference used NumPy 1.26.4 and SciPy 1.17.1. The script checks the input SHA-256 before fitting:
389be46927d2217b13d48b5b9ec56374007a87ea607c8e6f004c17683c427c70Live analysis completed September 8, 2026 UTC. Saved routing events record GLM-5.3-Flash followed by escalation to Grok 4.6 after a tool failure, through OpenRouter. The comparison is independent of the app code, but both calculations use SciPy; this is not a comparison between independent numerical libraries.