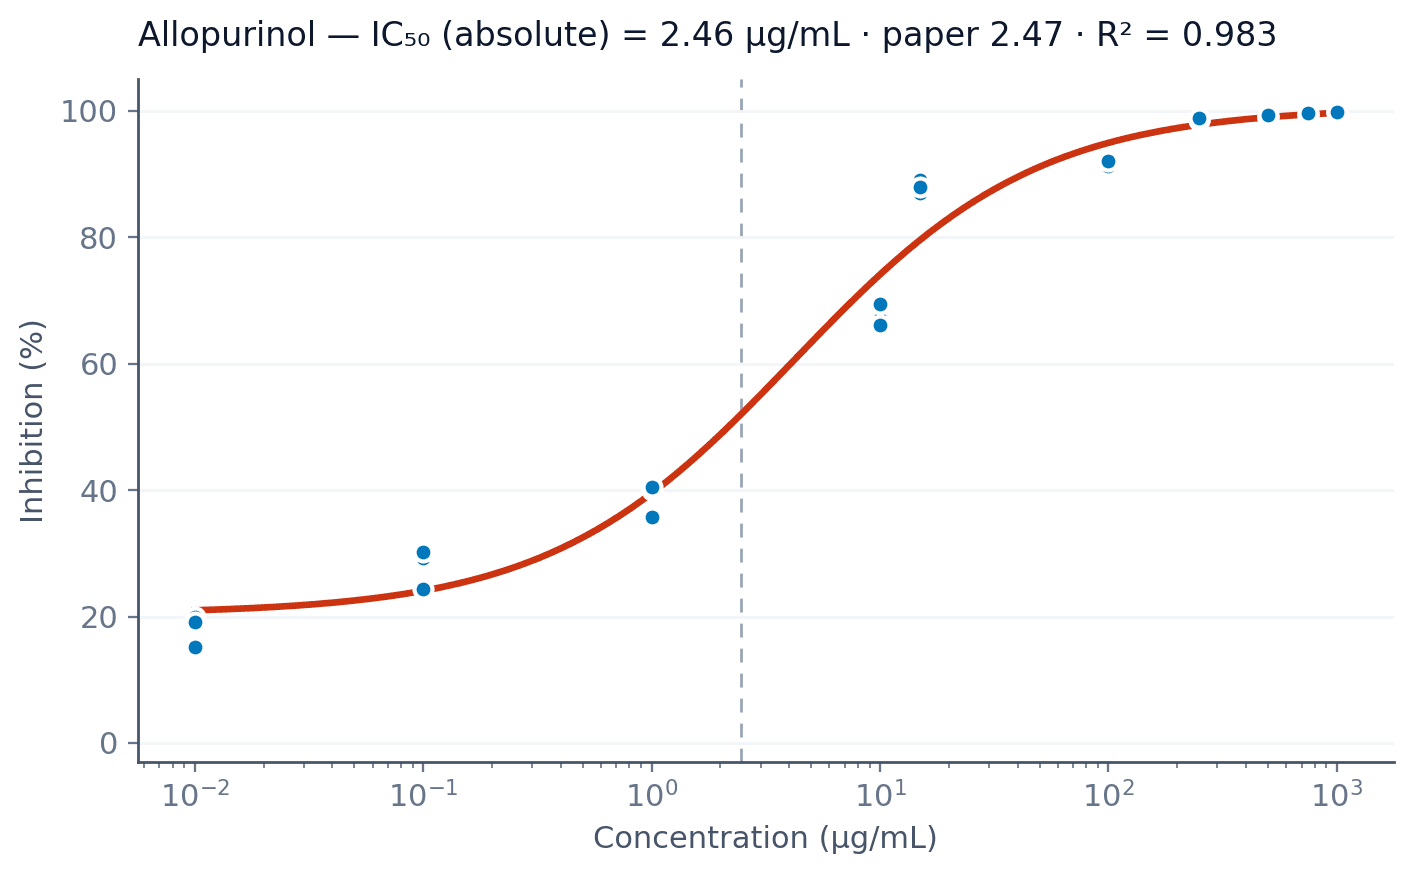
Gradiance fit allopurinol_v2.csv with a 4PL and returned IC₅₀ = 2.46 µg/mL — within 0.4 % of the value Li et al. report for the same compound against xanthine oxidase. Ten doses, three replicates per dose, R² = 0.983.
§ 01The dataset
The CSV holds thirty wells: ten allopurinol concentrations from 0.01 to 1000 µg/mL (a five-log span) at n = 3 each, with the inhibition values pre-normalised to a no-drug control. Run name in the database: "Dose-Response (IC50/EC50) - Apr 28".
Gradiance auto-detected the dose column, grouped the triplicates, and ran a 4PL on the medians.

§ 02Side by side
The IC₅₀ comparison is the only one we hold ourselves to publicly — that's the headline parameter the paper reports. The other 4PL parameters are listed for completeness, with an asterisk where we don't have a published value to compare against.
The bottom plateau came in at 20 % rather than at zero. That's the lowest-dose wells reading roughly 15–30 % inhibition rather than zero, probably background in the no-drug arm of the assay. The fit handles it fine; if you constrained Bottom to 0 it would push the IC₅₀ down somewhat.
§ 03Why a 4PL
The data plateau at both ends and the Hill magnitude is under 1, so a symmetric sigmoid is enough. A 5PL would add an asymmetry parameter the residuals don't ask for; Gradiance checked and skipped it.
One thing worth saying: the run report flagged the Hill slope of −0.81 as "cooperative inhibition". That description in the auto-narrative is misleading — |Hill| under 1 means less than single-site behaviour, not more. We've opened a ticket on the narrative templates. The fit itself is right; the prose around it isn't.
§ 04The script
The export bundle ships the script that reproduces the fit. Trimmed for length:
import pandas as pd
from scipy.optimize import curve_fit
import numpy as np
def fourpl(x, top, bottom, ic50, hill):
return bottom + (top - bottom) / (1 + (x / ic50) ** hill)
df = pd.read_csv("allopurinol_v2.csv")
x = df["dose_ug_per_ml"].to_numpy()
y = df["pct_inhibition"].to_numpy()
p0 = [100.0, 0.0, np.median(x), 1.0]
popt, pcov = curve_fit(fourpl, x, y, p0=p0, maxfev=10_000)
top, bottom, ic50, hill = popt
print(f"IC50 = {ic50:.4f} ug/mL")
print(f"Hill = {hill:.4f}")
print(f"Top = {top:.4f} Bot = {bottom:.4f}")Run it on a fresh machine, get the same four numbers.
Drop your CSV. Get the figure.
Free for three runs a month. No card. No template. The audit trail is on by default.